Tables
Last updated on 2025-07-01 | Edit this page
Estimated time: 12 minutes
Overview
Questions
- How do I add tables to a LaTeX document?
- How can I format a table in a LaTeX document?
Objectives
- Create a table in a LaTeX document.
- Customize the appearance of a table in a LaTeX document.
- Add horizontal lines to a table in a LaTeX document.
Defining Tables
Tables in LaTeX are set using the tabular environment.
For our purposes here, we are going to use the array
package to create a table, which provides additional functionality for
creating tables. We’ll add this to the preamble of our document:
Callout
As we start to add more and more packages to our preamble, it can get a bit unwieldy. For now, let’s just keep them alphabetized to make it keep things organized. Our imports should now look like this:
In order to create a table, we need to tell latex how many columns we will need and how they should be aligned.
Available column types are:
| Column Type | Description |
|---|---|
l |
left-aligned |
c |
centered |
r |
right-aligned |
p{width} |
a column with fixed width; the text will be automatically line wrapped and fully justified |
m{width} |
like p, but vertically centered compared to the rest of the row |
b{width} |
like p, but bottom aligned |
w{align}{width} |
prints the contents with a fixed width, silently overprinting if things get larger. (You can choose the horizontal alignment using l, c, or r.) |
W{align}{width} |
like w, but this will issue an overfull box warning if things get too wide. |
Callout
The columns l, c and r will have the natural width of the widest
entry in the column. Each column must be declared, so if you want a
table with three centered columns, you would use ccc as the
column declaration.
Creating a Table
Now that we have the array package loaded and we know how to define
columns, we can create a table using the tabular
environment.
Callout
Note that the & and \\ characters are
aligned in our example. This isn’t strictly necessary in LaTeX, but it
makes the code much easier to read.
LATEX
\section{Tables}
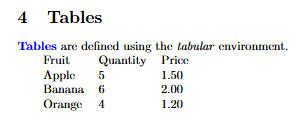
\kw{Tables} are defined using the \cmd{tabular} environment.
\begin{tabular}{lll}
Fruit & Quantity & Price \\
Apple & 5 & 1.50 \\
Banana & 6 & 2.00 \\
Orange & 4 & 1.20 \\
\end{tabular}This will create a table with three columns, all left-aligned. The
values of each row are separated by & and the rows are
separated by \\. We do not yet have any horizontal lines in
the table, so it will look like this:
Callout
If your table has many columns, it may get cumbersome to write out
the column definitions every time. In this case you can make things
easier by using *{num}{string} to repeat the string
num times. For example, in our table above, we can instead
write:
Adding Horizontal Lines
We’re going to introduce another package here: booktabs.
This package provides a few commands that make it easier to create
professional looking tables. To use it, add the following to your
preamble:
booktabs provides three commands for creating horizontal
lines in your table:
-
\toprule: creates a line at the top of the table -
\midrule: creates a line in the middle of the table -
\bottomrule: creates a line at the bottom of the table
Horizontal lines make tables easier to read and understand, and they can be used to separate the header from the body of the table, and the body from the footer. We can insert these commands into our table to add horizontal lines:
LATEX
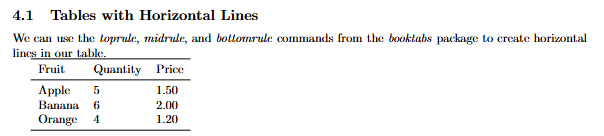
\subsection{Tables with Horizontal Lines}

We can use the \cmd{\textbackslash toprule}, \cmd{\textbackslash midrule}, and
\cmd{\textbackslash bottomrule} commands from the \cmd{booktabs} package to create horizontal
lines in our table.

\begin{tabular}{*{3}{l}}
  \toprule
  Fruit  & Quantity & Price \\
  \midrule
  Apple  & 5        & 1.50  \\
  Banana & 6        & 2.00  \\
  Orange & 4        & 1.20  \\
  \bottomrule
\end{tabular}
Your table should look something like this:
Callout
A general recommendation is to use lines sparsely in your tables, and vertical lines should be avoided.
Partial Horizontal Lines
Another useful feature of booktabs is the ability to
create partial horizontal lines with the \cmidrule command.
This command accepts the arguments {number-number}, where the first
number is the column to start the line and the second number is the
column to end the line.
LATEX
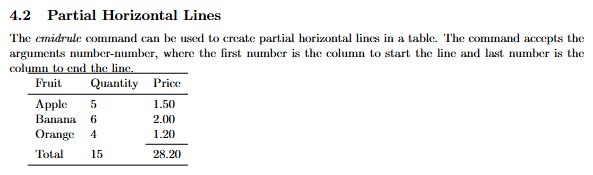
\subsection{Partial Horizontal Lines}

The \cmd{\textbackslash cmidrule} command can be used to create partial horizontal lines in a
table. The command accepts the arguments {number-number}, where the first number is the column to
start the line and last number is the column to end the line.

\begin{tabular}{*{3}{l}}
  \toprule
  Fruit  & Quantity &  Price \\
  \midrule
  Apple  & 5        &  1.50  \\
  Banana & 6        &  2.00  \\
  Orange & 4        &  1.20  \\
  \cmidrule{3-3}
  Total & 15        & 28.20  \\
  \bottomrule
\end{tabular}
This table should come out looking something like this:
Merging Cells
We can merge cells horizontally using the \multicolumn
command. This command takes three arguments:
- The number of cells which should be merged
- The alignment of the merged cell (l, c, or r)
- The contents of the merged cell
LATEX
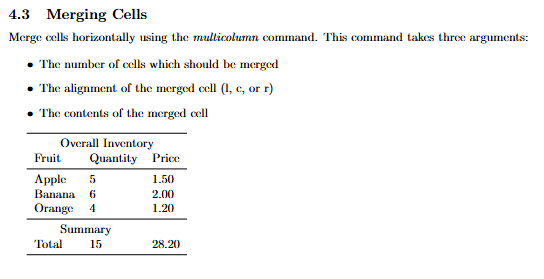
\subsection{Merging Cells}

Merge cells horizontally using the \cmd{\textbackslash multicolumn} command. This command takes
three arguments:

\begin{itemize}
  \item The number of cells which should be merged
  \item The alignment of the merged cell (l, c, or r)
  \item The contents of the merged cell
\end{itemize}

\begin{tabular}{*{3}{l}}
  \toprule
  \multicolumn{3}{c}{Overall Inventory} \\
  Fruit  & Quantity &  Price  \\
  \midrule
  Apple  & 5        &  1.50   \\
  Banana & 6        &  2.00   \\
  Orange & 4        &  1.20   \\
  \midrule
  \multicolumn{2}{c}{Summary} \\
  Total & 15        & 28.20   \\
  \bottomrule
\end{tabular}
Callout
Vertical merging is supported in LaTeX by using the
multirow package which has the \multirow
command equipped with it. It is similarly structured as
\multicolumn by using three arguments:
- The number of rows which should be merged
- The width of the column (i.e. 4em)
- The contents of the merged rows.
You can find an example in the challenges below.
This will create a table that looks like this:
Challenges
Challenge 1: Can you do it?
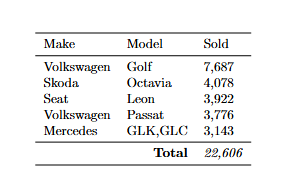
Try to replicate the following table in LaTeX:
| Make | Model | Sold |
|---|---|---|
| Volkswagen | Golf | 7,687 |
| Skoda | Octavia | 4,078 |
| Seat | Leon | 3,922 |
| Volkswagen | Passat | 3,776 |
| Mercedes | GLK,GLC | 3,143 |
| Total | 22,606 |
Your LaTaX version should look something like this.
Note that the last row is a bit different from the others. The first two columns re merged, the text “Total” is right-aligned and bold, and the value in the last column is italicized.
(Data for this challenge is from Statista)
LATEX
\documentclass{article}

\usepackage{array}
\usepackage{booktabs}

\begin{document}

\begin{tabular}{lll}
  \toprule
  Make        & Model   & Sold   \\
  \midrule
  Volkswagen  & Golf    & 7,687 \\
  Skoda       & Octavia & 4,078 \\
  Seat        & Leon    & 3,922 \\
  Volkswagen  & Passat  & 3,776 \\
  Mercedes    & GLK,GLC & 3,143 \\
  \midrule
  \multicolumn{2}{r}{\textbf{Total}} & \textit{22,606} \\
  \bottomrule
\end{tabular}

\end{document}
Challenge 2: Merging rows.
Consider the following LaTeX code that creates a table using the
command \multirow. Can you guess how this table will look
like? How many columns will it have? How many rows? Are any rows or
columns combined?
LATEX
\documentclass{article}

\usepackage{booktabs}
\usepackage{multirow}

\begin{document}

\begin{tabular}{*{4}{l}}
  \toprule
    & Food & Quantity &  Price  \\
  \midrule
  \multirow{3}{4em}{Fruit} & Apple  & 5  &  1.50   \\
  & Banana & 6        &  2.00   \\
  & Orange & 4        &  1.20   \\
  \midrule
  \multirow{2}{4em}{Cheese} & Brie & 2 & 3.30 \\
   & Asiago   & 3 & 2.90   \\
  \bottomrule
\end{tabular}

\end{document}The table will have 4 columns where the first column does not have a column name. The table will have 6 rows. The first row is the column name row. Rows 2 to 4 are merged for “Fruit”. Rows 5 and 6 are merged for “Cheese”.
Hint: We want to make sure the caption stays with the table, so we should put the table inside an environment. For images we use the “figure” environment, but for tables we can use the “table” environment.
Challenge 3: Adding merged rows to your table.
Consider again the LaTeX code for the table in challenge 3. Add four more rows to this table that contain information about the following four sorts of bread:
- Brioche, 3, 3.00
- Bagel, 2, 3.50
- Matzah, 4, 3.60
- Naan, 2, 3.40
Use \multirow to subsume those bread types under the
category “Bread”.
LATEX
\documentclass{article}

\usepackage{booktabs}
\usepackage{multirow}

\begin{document}

\begin{tabular}{*{4}{l}}
  \toprule
    & Food & Quantity &  Price  \\
  \midrule
  \multirow{3}{4em}{Fruit} & Apple  & 5  &  1.50   \\
  & Banana & 6        &  2.00   \\
  & Orange & 4        &  1.20   \\
  \midrule
  \multirow{2}{4em}{Cheese} & Brie & 2 & 3.30 \\
   & Asiago   & 3 & 2.90   \\
   \midrule
  \multirow{4}{4em}{Bread} & Brioche & 3 & 3.00 \\
  & Bagel & 2 & 3.50 \\
  & Matzah & 4 & 3.60 \\
  & Naan & 2 & 3.40 \\
  \bottomrule
\end{tabular}

\end{document}
Challenge 4: Making the Table Colorful
We used the xcolor package to add color to our text in
an earlier episode. Can you use the xcolor package to make
the header and summary rows of the table in Challenge 1 a different
color? What about changing the color of the text in the summary row? Can
we make the rows of the table alternate colors?
A few things that will help you: - We need to import the
xcolor package in the preamble of our document. - The
xcolor package doesn’t automatically support coloring
tables, so we need to add the table option to the package
import. - \rowcolor{(<color>} -
\rowcolors{<starting row number>}{<color1>}{<color2>}
- You can make lighter versions of colors by adding
!<percentage> to the color name. For example,
red!10 is a light red color, while red!90 is a
darker red color.
There’s no right answer to this challenge, so feel free to experiment with different colors! Here’s an example of what you can do.
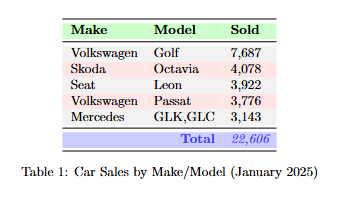
LATEX
\documentclass{article}

\usepackage{array}
\usepackage{booktabs}
\usepackage[table]{xcolor} % Import xcolor with the table option

\begin{document}

\begin{table}[ht]
  \centering
  \rowcolors{2}{red!10}{gray!10} % Alternate row colors between red and gray
  \begin{tabular}{lll}
    \toprule
    \rowcolor{green!20} % Set the header row color to green
    Make          & Model            & Sold  \\
    \midrule
    Volkswagen    & Golf             & 7,687 \\
    Skoda         & Octavia          & 4,078 \\
    Seat          & Leon             & 3,922 \\
    Volkswagen    & Passat           & 3,776 \\
    Mercedes      & GLK,GLC          & 3,143 \\
    \midrule
    \rowcolor{blue!20} % Set the summary row color to blue
    \multicolumn{2}{r}{
      % Set the text color to blue and bold for the summary row
      \textbf{\textcolor{blue!75}{Total}}} & \textit{\textcolor{blue!75}{22,606}} \\
    \bottomrule
  \end{tabular}

  \caption{Car Sales by Make/Model (January 2025)} % Add a caption to the table

\end{table}

\end{document}
Key Points
- Tables in LaTeX are created using the
tabularenvironment. - The
arraypackage provides additional functionality for creating tables. - The
booktabspackage provides commands for creating horizontal lines in tables. - The
\multicolumncommand can be used to merge cells in a table. - The
\multirowcommand in themultirowpackage can be used to merge rows in a table.
After this episode, here is what our LaTeX document looks like.