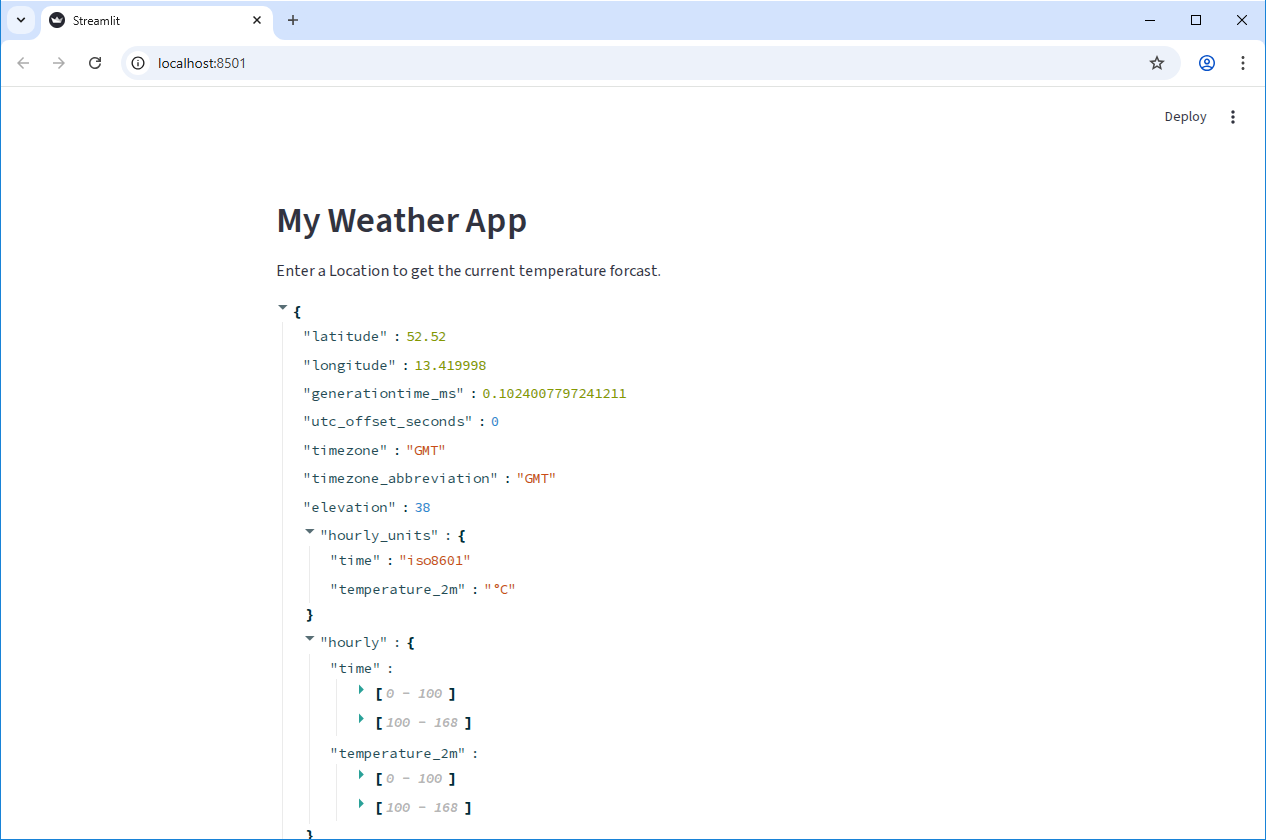
Image 1 of 1: ‘Raw JSON data from the Open-Meteo API displayed in a Streamlit app.’
Figure 2
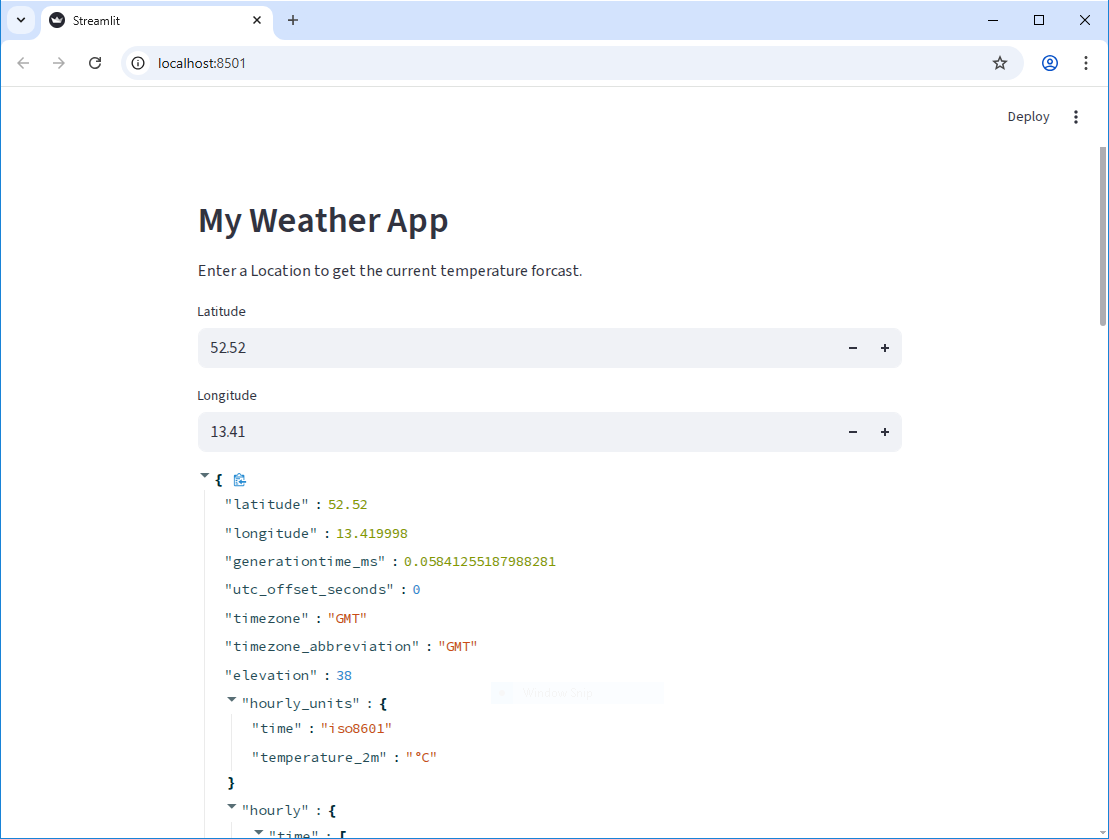
Image 1 of 1: ‘Raw JSON data from the Open-Meteo API displayed in a Streamlit app, with number input widgets for latitude and longitude.’
Figure 3
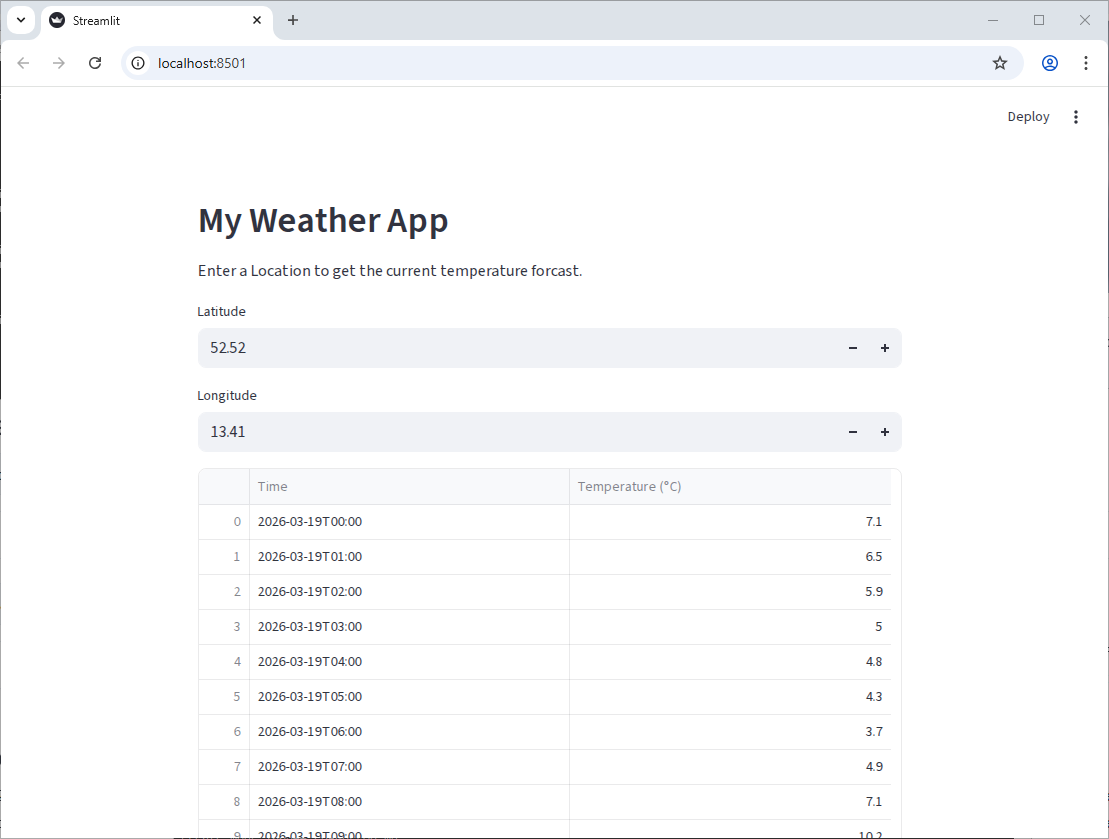
Image 1 of 1: ‘A Pandas DataFrame created from the API data, displayed in a Streamlit app.’
Figure 4
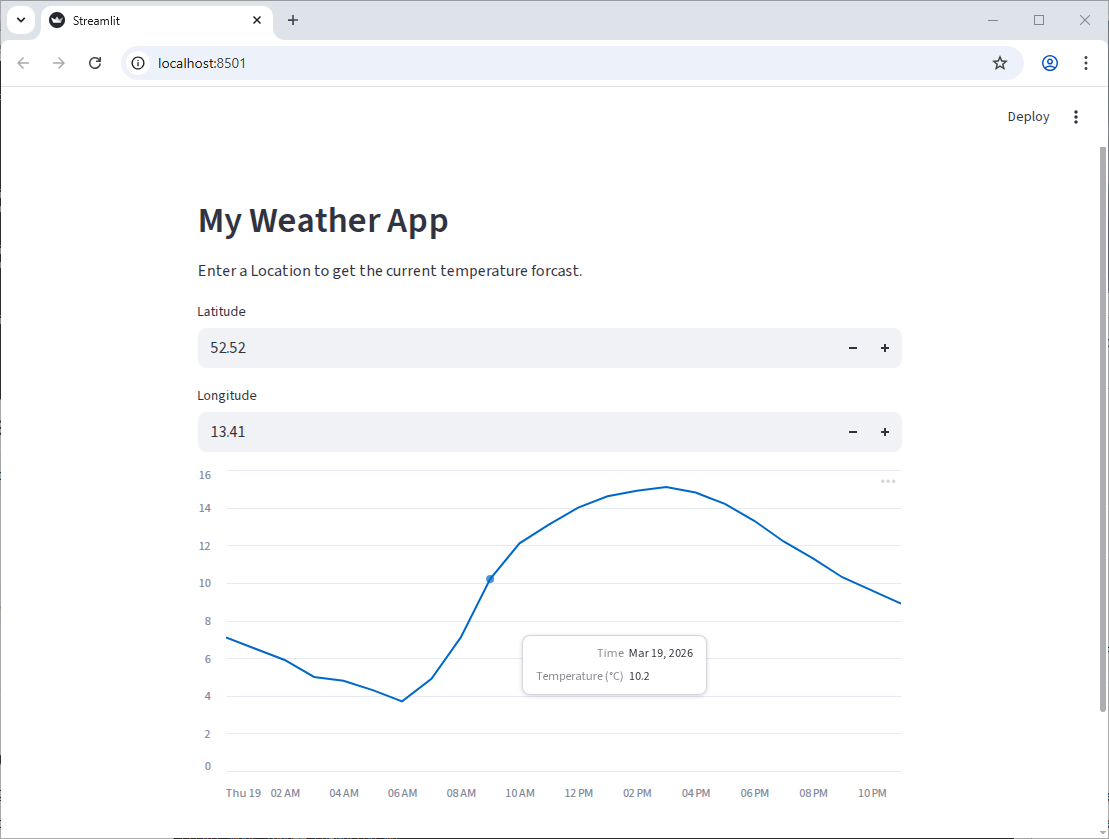
Image 1 of 1: ‘A line chart in Streamlit showing the hourly temperature forcast for a specific location.’
Figure 5
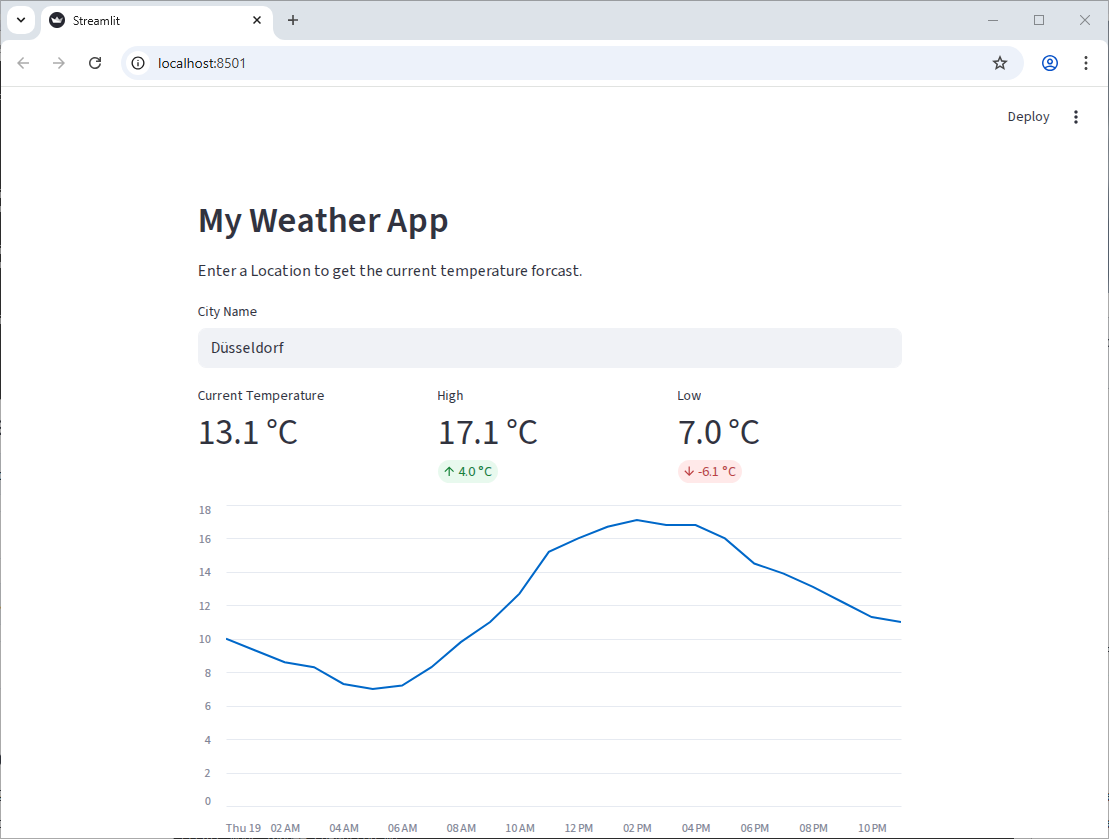
Image 1 of 1: ‘A Streamlit app showing the current temperature, high, and low for a specific location, along with a line chart of the hourly temperature forcast.’